Cart 0


What to Expect From a PPC Management Agency
Engaging in the hiring process of a PPC management company is indeed a big decision

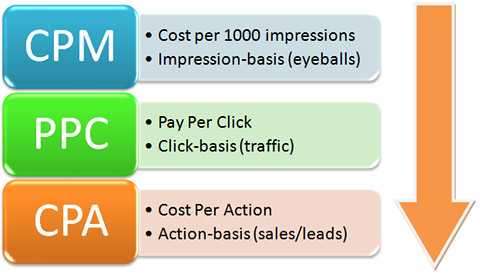
A PPC curve is a graphical way of representing the relationship between advertising variables in a pay-per-click campaign, such as ad spend, clicks, conversions, or return on investment. The concept borrows from the economic idea of diminishing returns: past a certain point, each additional dollar of ad spend tends to produce a smaller incremental result than the dollar before it.
Understanding the PPC curve can help businesses make better decisions about campaign budgets, bidding strategies, keywords, and expected results — especially when planning a broader PPC management strategy.
The term “PPC curve” doesn’t refer to one universally standardized formula or chart. It’s more commonly used to describe a curve or graph that illustrates how PPC results change relative to advertising investment, or some other campaign variable. A marketer might chart PPC spend against clicks, conversions, cost per acquisition, or revenue — the goal is always to visualize the relationship between two variables and see whether increasing investment is still producing proportional improvements.
In a simple example, a company spends $1,000 on PPC and generates 50 leads. It increases its budget to $2,000 and gets 90 leads instead of 100. It increases the budget again to $3,000 and gets only 110 leads. The curve shows that additional spending is still producing more leads — but the efficiency of each additional dollar is declining.
PPC campaigns run in competitive environments, so increasing a budget doesn’t guarantee performance increases at the same rate. A business can double its spending without doubling its conversions, often because the most valuable searches and audiences have already been captured, leaving only less efficient opportunities for the extra budget.
Instead of asking “how much more should we spend?”, the PPC curve pushes marketers toward a more useful question: “how much additional business value are we getting from each additional dollar?” That framing matters when deciding whether a campaign should be expanded, held steady, or optimized before adding more budget.
A basic PPC curve plots advertising spend on the horizontal axis and a performance metric — usually conversions — on the vertical axis. The curve often rises quickly at first, because the campaign is capturing highly relevant searches and audiences. As spending increases, the curve tends to flatten, meaning additional spend is generating fewer incremental conversions. The general progression looks like this:
Diminishing returns occur when increasing PPC investment produces smaller incremental improvements. A business spends $500 and gets 20 conversions. It increases spend to $1,000 and gets 45 conversions — the extra $500 generated 25 more conversions. It increases spend again to $1,500 and gets 60 conversions — that same $500 increment now generated only 15 more. The campaign is still growing, but each additional dollar is becoming less productive. The goal isn’t necessarily to maximize spending; it’s to find the spending level that balances volume, efficiency, and profitability.
Cost per click (CPC) is another variable that shapes a PPC curve. Higher competition for valuable keywords increases the cost required to generate traffic. A company might initially capture lower-cost clicks from highly relevant terms, then start competing for more expensive keywords as it expands — meaning a higher budget can produce more clicks, but at an increasingly higher average cost. Ongoing PPC management services can help monitor budgets, targeting, and optimization opportunities as this shifts.
Conversion rate also affects the shape of the curve. Suppose a campaign generates 1,000 clicks and 50 conversions — a 5% conversion rate. If it expands to 2,000 clicks but only 70 conversions, the rate has fallen to 3.5%, which usually means the additional traffic is less qualified. Contributing factors can include broader keyword targeting, less specific search intent, more expensive audiences, geographic expansion, or weaker landing pages. This is why a PPC curve shouldn’t be evaluated on traffic alone — more clicks doesn’t automatically mean better performance.
Cost per acquisition (CPA) measures how much spend is required to generate one conversion, and it’s especially useful for evaluating profitability:
The campaign is generating more conversions as the budget grows, but acquisition costs are rising too. The PPC curve can help identify the point where increasing spend stops making economic sense — if additional conversions are worth less than the additional ad cost, it’s time to optimize before spending more.
For e-commerce and revenue-focused campaigns, return on ad spend (ROAS) compares revenue generated to the amount spent. A company spending $2,000 and generating $8,000 in attributed revenue has a 4:1 ROAS. Increasing the budget could produce more revenue and more conversions, but also higher acquisition costs and a lower ROAS — which isn’t automatically a bad decision if the additional revenue supports growth goals. The PPC curve provides a framework for weighing that trade-off deliberately.
One of the most practical uses of a PPC curve is budget planning. Rather than automatically increasing spend, marketers can compare expected outcomes at different budget levels:
| Monthly PPC Budget | Expected Conversions | Estimated CPA |
|---|---|---|
| $1,000 | 50 | $20.00 |
| $2,000 | 85 | $23.53 |
| $3,000 | 105 | $28.57 |
| $4,000 | 115 | $34.78 |
This table suggests that increasing the budget keeps generating conversions, but incremental efficiency decreases the higher it goes. A business might decide the $2,000–$3,000 range offers a better balance of growth and efficiency than pushing to $4,000. Actual numbers vary by campaign, market, and platform, but the underlying principle holds.
An advertisement should generally lead to a page that matches the searcher’s intent — an ad for a specific service should point to that service’s page, not a generic homepage. Clear messaging, relevant content, strong calls to action, fast load times, and simple forms all influence whether a click converts. Businesses can lean on web design services and web development services when the landing page itself is the bottleneck holding back the curve.
PPC and SEO complement each other well. PPC can provide immediate visibility for a valuable search term while an organic page is built to rank for the same query over time. PPC data — which keywords, messages, and offers convert — can also inform organic strategy, and strong organic rankings can eventually reduce how much traffic a business needs to buy. Businesses can explore SEO services as part of a combined search strategy.
A flattening curve isn’t necessarily a signal to stop spending — it’s usually a signal to optimize. Common improvements include refining keyword targeting, removing poor-performing keywords, testing new ad copy, adjusting geographic targeting, improving landing pages, reviewing audience segments, adjusting bids, improving conversion tracking, and reallocating budget toward higher-performing campaigns.
A PPC curve is a useful analytical tool, but it shouldn’t be the only input into a budget decision. Customer lifetime value, profit margins, sales cycle length, lead quality, brand awareness, and seasonality all matter too. A campaign with a higher CPA might still be worthwhile if it brings in customers with significantly higher lifetime value, while a campaign with great short-term ROAS might not be the best long-term bet if its growth potential is capped.
What is the definition of a PPC curve?
A PPC curve is a graphical representation of the relationship between PPC advertising investment and a performance metric such as clicks, conversions, revenue, CPA, or ROAS. It helps marketers understand how performance changes as spending or another variable changes.
What does a PPC curve show?
It shows whether increasing advertising investment produces proportional, lower, or higher incremental results, and it’s particularly useful for spotting diminishing returns.
Why does a PPC curve flatten?
Limited search volume, rising competition, audience saturation, higher CPCs, lower-intent traffic, or landing page limitations can all cause a curve to flatten.
Is a higher PPC budget always better?
No. A higher budget can generate more traffic and conversions, but the additional results often become progressively less efficient. Incremental conversions, CPA, revenue, and profitability all need to be weighed together.
Can SEO and PPC be used together?
Yes. SEO and PPC complement each other by combining long-term organic visibility with immediate paid exposure, and PPC data can inform SEO decisions.
The PPC curve is a useful way to visualize how advertising investment relates to campaign performance, rather than assuming more spend always means proportionally better results. The most valuable PPC strategy isn’t the one with the biggest budget — it’s the one that allocates investment where it produces meaningful results while staying efficient. Want a second set of eyes on your PPC budget curve? Schedule a consultation with Triforce Digital Marketing.
Engaging in the hiring process of a PPC management company is indeed a big decision
PPC advertising — short for pay-per-click — is one of the most direct ways to

Most Dallas businesses running Meta ads are burning budget on the wrong audience. Here’s what
Please Check Your Inbox to Download the Resource!